Predictive Analytics for Industrial Applications

Key Takeaways
- Predictive analytics use past behaviors to identify likely future behaviors.
- Industrial applications of predictive analytics focus on increasing OEE (Overall Equipment Effectiveness).
- If your OEE is limited by reliability or availability, then predictive analytics approach is a good starting point.
You probably encounter predictive analytics every day in…
- Social media – Facebook’s newsfeed and Twitter’s best tweets.
- Shopping – Amazon’s book recommendation or Target’s identification of new parents-to-be
- Broadcast media – Netflix’s movie queue suggestions and Spotify’s Recommended songs.
- Finance – Loan application risk or credit card fraud detection
The basic idea is this: given some information about your behavior in the past, can I determine, within a limited context, what you’ll do in the future? While industrial applications for predictive analytics look different from those in the commercial space, the same basic idea applies: given some past information about equipment, a process or a plant, can I determine how it will behave in the future?
Applications of Predictive Analytics in Industry
Commercial and social applications tend to revolve around making recommendations because suggesting what someone might want next increases prospect engagement and influences their buying behavior. Financial applications tend to revolve around risk assessment because understanding risk helps maximize investment returns in the face of uncertainty. Industrial applications tend to revolve around availability and quality because these metrics are key to ensuring that a plant delivers usable products, on schedule, at an acceptable cost.
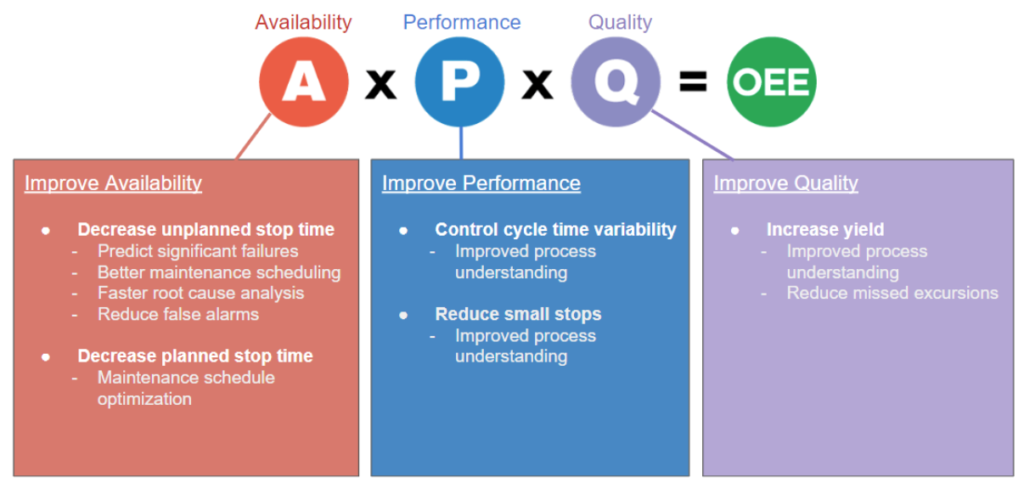
Predictive analytics can be used to address a variety of problems and increase OEE for a plant.
- Availability use cases aim to decrease the total amount of planned and unplanned equipment stoppage.
- Part failure prediction. E.g. Predicting that a pump is about to fail so that it can be shut down and replaced before it results in equipment damage and a long, costly recovery process.
- Predicting regulatory compliance issues. E.g. Determining that safe emissions levels are likely to be exceeded so that operating parameters can be changed to avoid mandatory shutdown, investigation and a fine.
- Predictive maintenance. E.g. Detecting when an early service cycle is needed to optimize technicians’ schedules and minimize total downtime.
- Reducing false positives through better quality alarms. E.g. Replacing a traditional Statistical Process Control (SPC) based alarm with a higher precision, ML based alarm in order to reduce the number of times equipment is incorrectly inhibited, thereby increasing capacity of the line.
- Quality use cases focus on minimizing the amount of misprocessed material made by the production line.
- Finding better process parameters. E.g. Identifying the likely system response to changing inputs in order to identify the best settings for a particular target outcome.
- Identifying yield losses earlier than can be done with existing quality monitoring methods. E.g. Determining that defects were generated during a cold rolling process immediately after rolling finishes instead of hours later when lab results are processed.
Predictive Analytics Approaches
There are two basic approaches to predicting the behavior of systems: physics-based and statistics-based. Each has advantages and disadvantages which determine when it is appropriate to apply one or the other.
Physics-based approaches rely on a deep understanding of either the entire system or of critical parts of the system being monitored. Broadly speaking there are two ways to follow this path:
- Physics-based models – Are mathematical expressions which describe the relationship between inputs and outputs. Such models can be very powerful as they provide ways to simulate the entire system, estimating outputs for a set of inputs (e.g. sensor values at a given time). However, these models can be very difficult to build. They require computational and software expertise to create the mathematical models. They also require a deep understanding of the system’s design and construction. This knowledge is frequently available to the manufacturer of a system but is rarely available to users of the equipment.
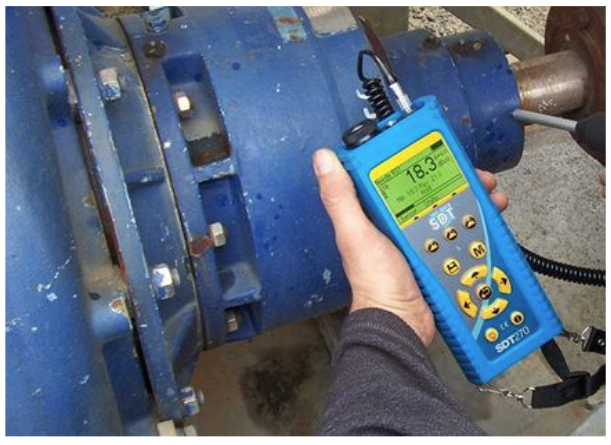
- Specialized sensor-based models – Are embodied in physical equipment attached to or built into a system which are tuned to detect specific behaviors of that equipment. The design of the sensors are such that specific behaviors of interest are detected. For example, vibration sensors may be designed and installed to detect a specific behavior of a spinning shaft which indicates abnormal wear. Specialized sensors can be powerful in finding specific behaviors but are limited for the same reason and can be expensive to install and maintain.
Statistics-based approaches rely on finding reliable relationships between some system measurement and a system state (e.g. between a sensor reading and a bearing failure).
Broadly speaking, there are three approaches describing these relationships:
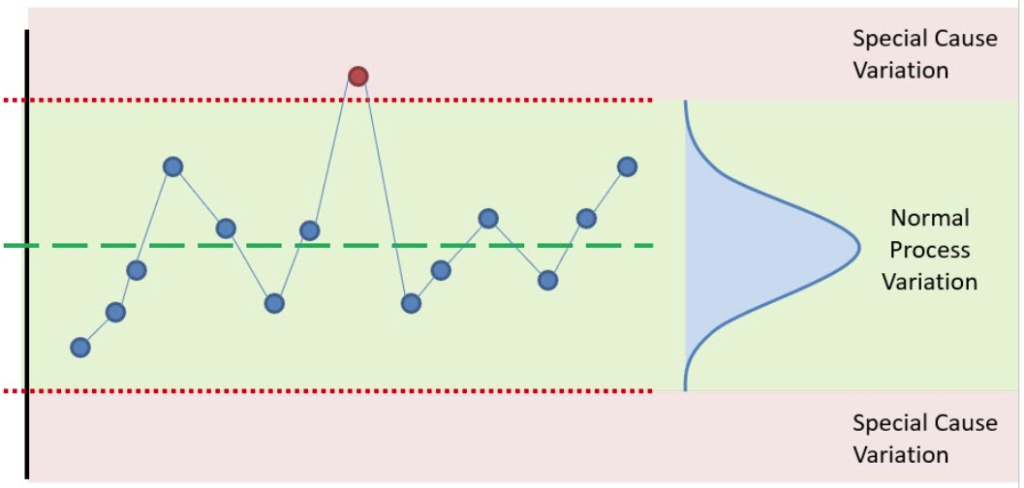
- Rule-based models – Capture the simplest relationships between measurement and outcome. Statistical Process Control (SPC) is a good example of this approach. The approach typically looks at sensors or measurements one at a time and defines a threshold which, when exceeded, indicates that some unusual or “bad” behavior is either occurring or likely to occur. This approach is very simple to implement and can be relatively quick to deploy even for new, poorly characterized systems. However, its ability to find interesting behaviors is limited and it tends to produce high levels of false positives when applied to more subtle or complex problems.
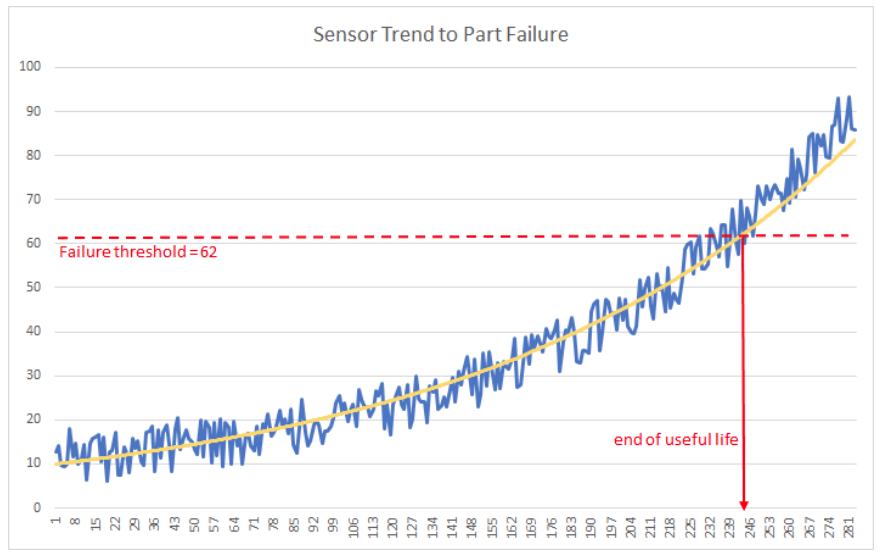
- Regressions / correlations – Capture more complex relationships in the form of an explicit mathematical function. The approach usually involves multiple sensors or measurements in combination to estimate some system state. For example, a curve fit to a health index might show the remaining useful life of a valve. This approach generally requires significant amounts of data in order to establish the functional relationship. It also tends to require a smooth trend in the behavior being modeled for predictions to be effective.
- Machine learning (ML) methods – Include a broad range of techniques which establish the relationship between measurement and outcome using a hidden function that a machine determines automatically. “Unsupervised learning” refers to the approach where relationships are established without an expert’s definition of what the systems states of interest are. “Supervised learning” refers to the approach where states of interest are defined by a person.
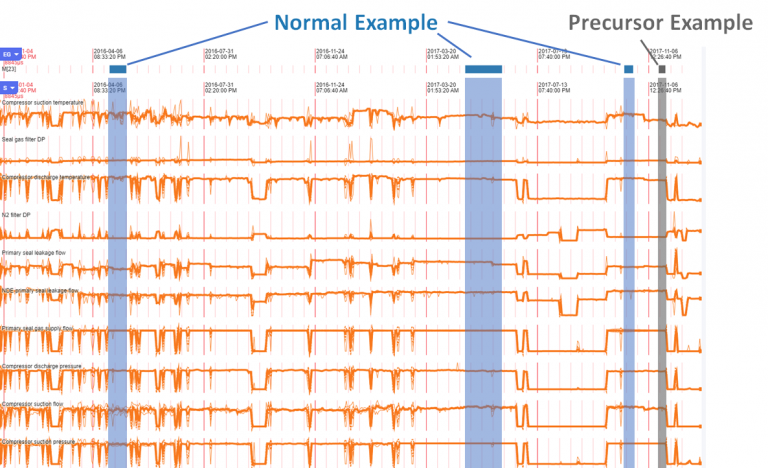
For example, unsupervised ML might take sensor readings over time and tell a user both that a pump operated in 4 distinct ways and the times when those operational modes occurred. Supervised ML might take those same readings and classify the pump operation into 3 specific states of interest: normal operation, cavitation and shut-down.
Machine learning based techniques can be very powerful, able to find very subtle relationships between sensor values and system states. However, unlike Falkonry Time Series AI, ML tools typically require significant work by data scientists to define features, select algorithms and tune parameters to achieve the desired results.
Finding the Right Predictive Analytic Approach for You
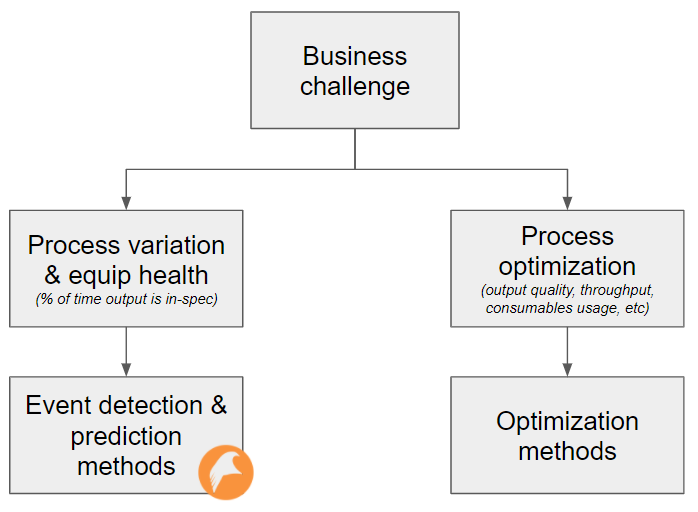
The saying “use the right tool for the job” applies in analytics just as it applies in maintenance. The approach you should take depends on the outcome you want to achieve. Broadly speaking, one can break Industrial Predictive Analytics applications into two categories: Optimization and event detection / prediction.
Optimization means determining how inputs should be adjusted in order to achieve some desired output. Traditionally, this has been done through design of experiment (DOE) where parameters are systematically varied and the outcomes observed. As computers have become more powerful and less expensive, simulation is increasingly supplementing DOE in order to speed the time to results by reducing the parameter space which must be explored. Getting to an optimal output in less time means more time producing in an optimal way.
Event detection and prediction means finding and understanding system behaviors so that they can be avoided or fixed. This has been done through a combination of inspections and SPC but is being increasingly supplemented and replaced by predictive analytics methods. As cost pressures increase, it has become more important to find issues early so that their impact on OEE is minimized.
Which approach to pursue depends on where your excess costs are coming from:
- If your manufacturing operations are limited by equipment availability or equipment health, i.e. you know where in process space to operate the equipment but are unable to operate there reliably, then pursuing a path focused on event detection and prediction using statistical or sensor-based methods is probably right for you.
- If your operations are limited by process yields, throughput or related factors coming from the settings used in the process equipment itself, then pursuing a path focused on optimization is probably right for you.
Implementing Predictive Analytics for the Fastest Return on Investment
When evaluating new analytics tools, it is common to start by looking at historical data. If this works on an old dataset, then it will work for current operations. However, experience suggests that this does not work as expected in industrial operations because the record keeping during operations is not amenable to advanced predictive analytics. While there is frequently less organizational resistance to starting with a proof of concept (POC), understanding what the POC results actually tell you about the business impact of the technology is difficult. This is because the operational experts who are needed to provide context and interpret the impact of analysis results don’t have the free time to look at problems which happened a year or two ago. Without the support of the subject matter experts (SME) critical buy-in is not established. Likewise, because the problem being “solved” in the POC is old, there is usually little practical impact that investigating it has on production today. Without SME support and without a clear bright spot where a current production problem has been solved, analytic products get stuck in POC purgatory, withering from lack of interest and dying.
Instead of starting with a POC, going straight to a limited production pilot can result in better results. By taking this path, the problems which result in projects getting stuck are addressed:
- Data and context is fresh so interpreting findings is much easier.
- Operational experts are engaged because the insights they receive are relevant to their day-to-day job.
- Solutions affect real production output making value propositions concrete and clear.
- Real integration requirements are found more quickly so that, when the time comes to scale-up, the way is already cleared.
By following this approach, teams can show value quickly and get a fast return on their predictive analytics investment.
There are a wide variety of predictive analytics packages available on the market today. However, few of them support a predictive operations approach – an approach that emphasizes working on today’s production challenges with current data, fully engaged with operational experts in a production pilot instead of a proof-of-concept. If your progress on the path to operational excellence is limited by your current event detection and prediction capabilities, we can help. Contact us to learn more about Falkonry Time Series AI can accelerate your journey to predictive operations.