Organizing Signals in Falkonry

Key takeaways:
- Existing industrial systems generate a large amount of time-series data that can be easily connected to Falkonry.
- Additional contextual information is useful for understanding system behaviors. ISO 14224 provides one well-documented approach to organizing this information.
- Signal trees are the basis of signal organization in Falkonry. In Falkonry, signal trees are dynamic and can be refined over time as sensor infrastructure evolves.
- Falkonry leverages signal tree organization to make common tasks easier and AI-powered analysis smarter.
The Data Challenge
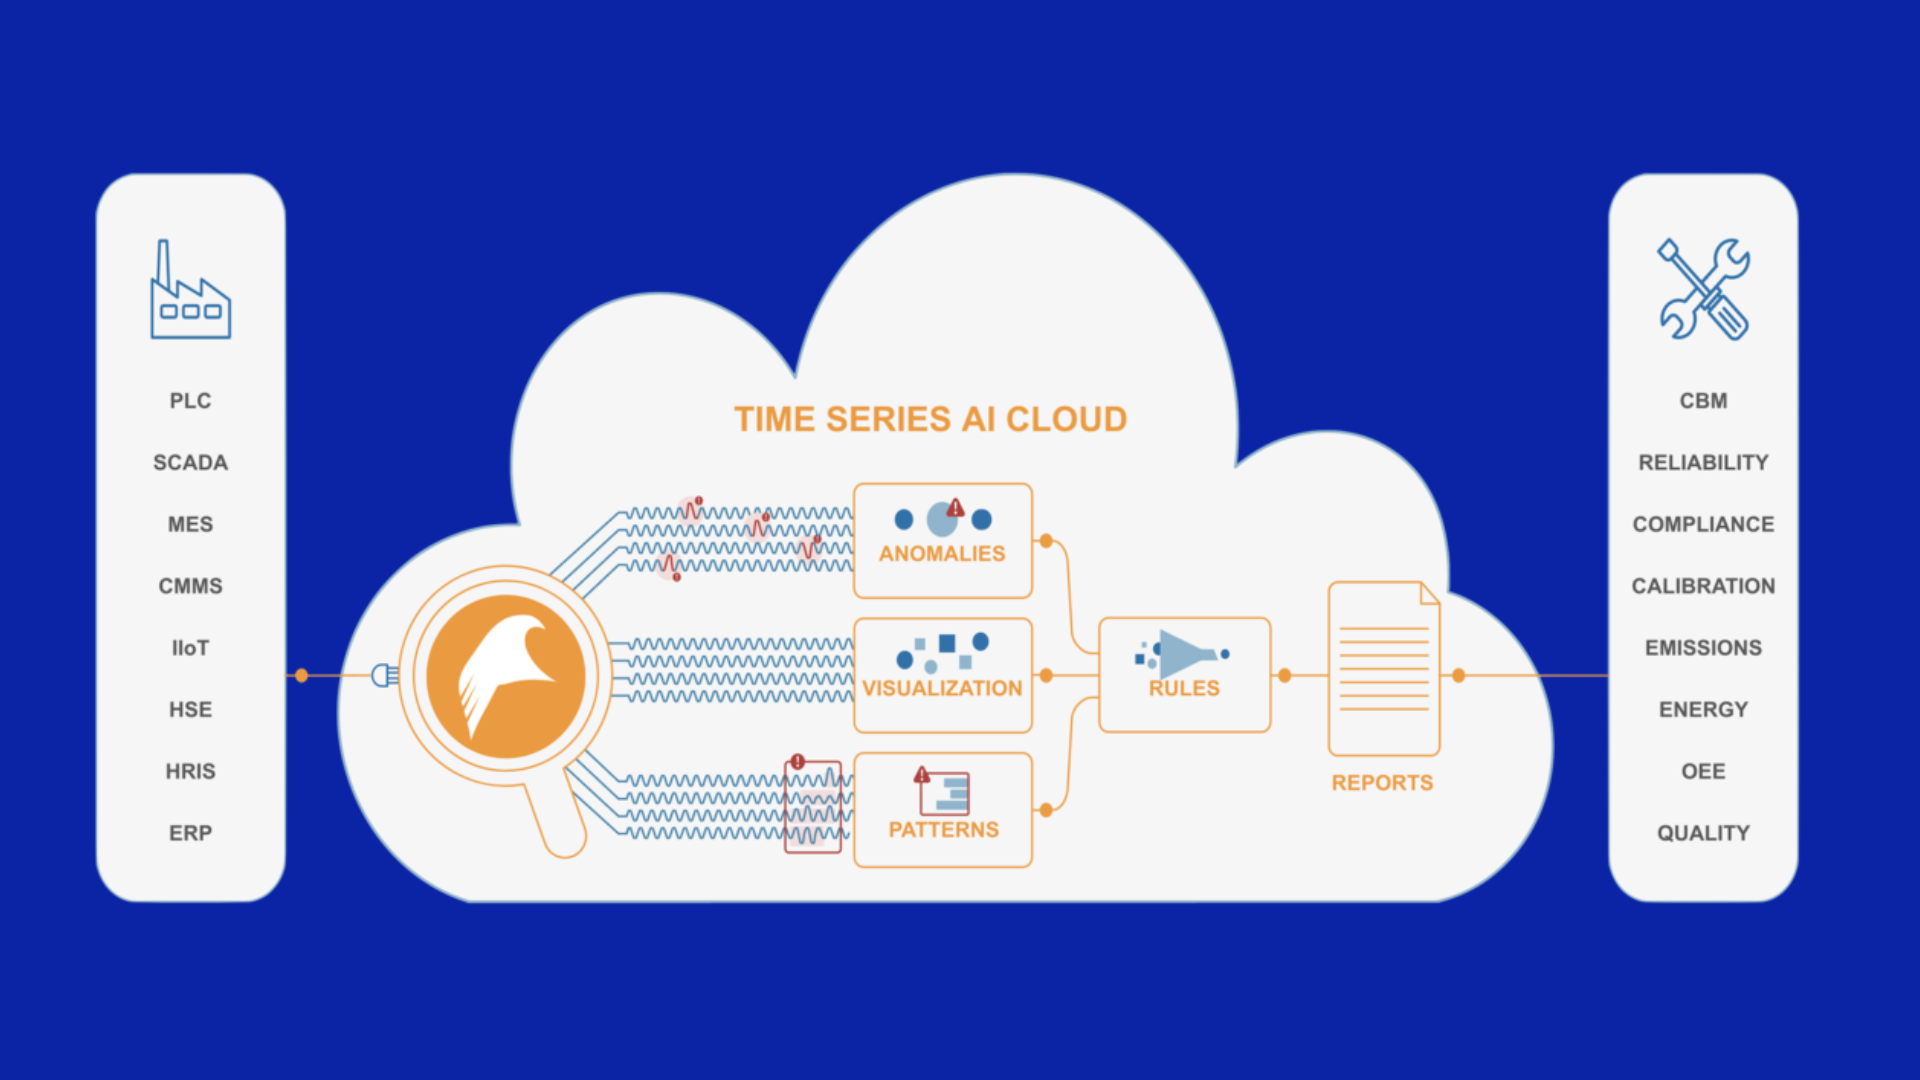
In today’s fast-paced and highly competitive industrial landscape, companies are seeking ways to improve efficiency and productivity. One of the ways to achieve these goals is through the implementation of industrial automation systems. These systems generate an enormous amount of data over time across thousands of measurement sources. This time series data is useful in monitoring and optimizing industrial processes, and can provide insights into asset performance, yield improvement, energy usage, and quality control to name a few. Managing numerous measurement sources and their data is challenging and requires a scalable, robust, and secure data infrastructure. There is a need for a single self-service system that can provide the necessary infrastructure support to handle this time series data with contextual information and make the data accessible for AI-powered insights.
Connecting Data
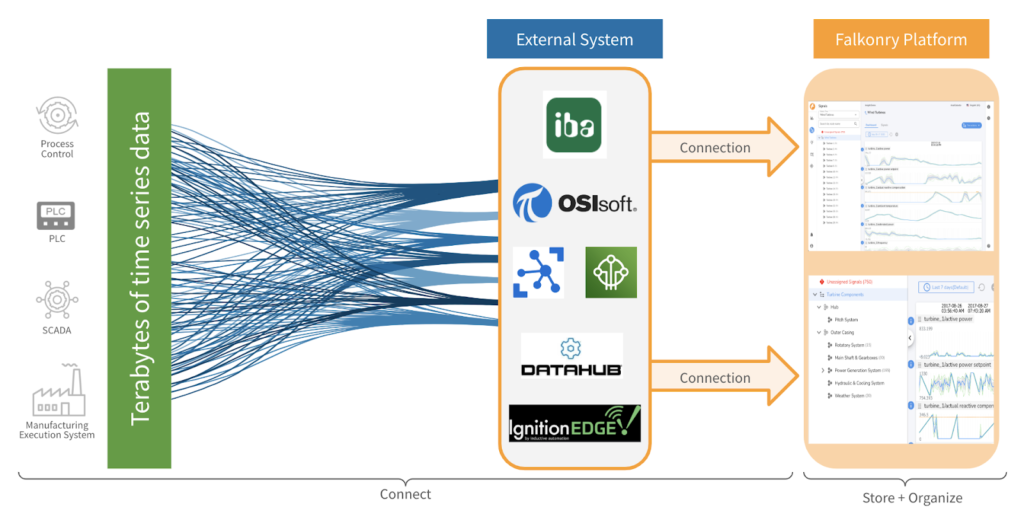
Data silos are a common problem across industrial companies. Data is scattered across different business units making it difficult to get a holistic view. This is one of the reasons why companies need to adopt centralized data platforms. A centralized data platform simplifies the path to a single source of truth and offers a way to put the power of data to use.
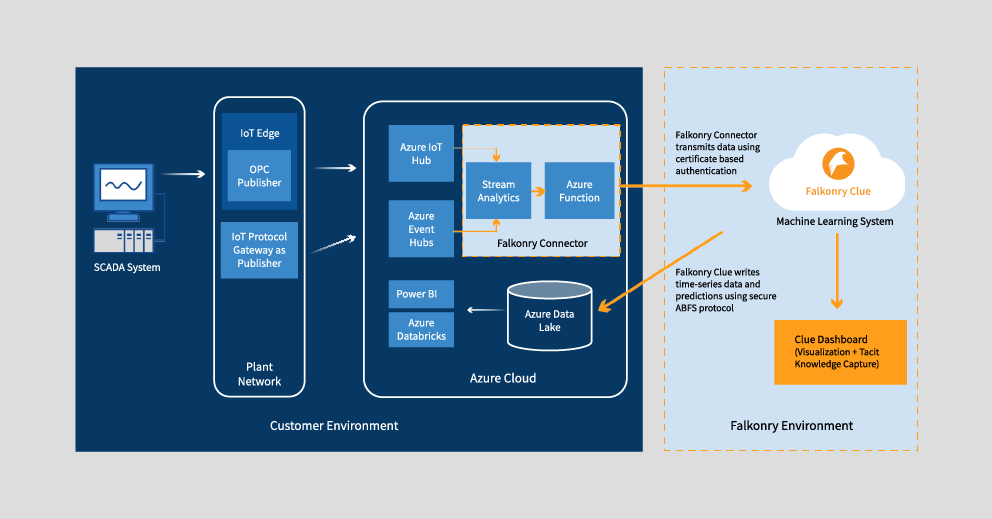
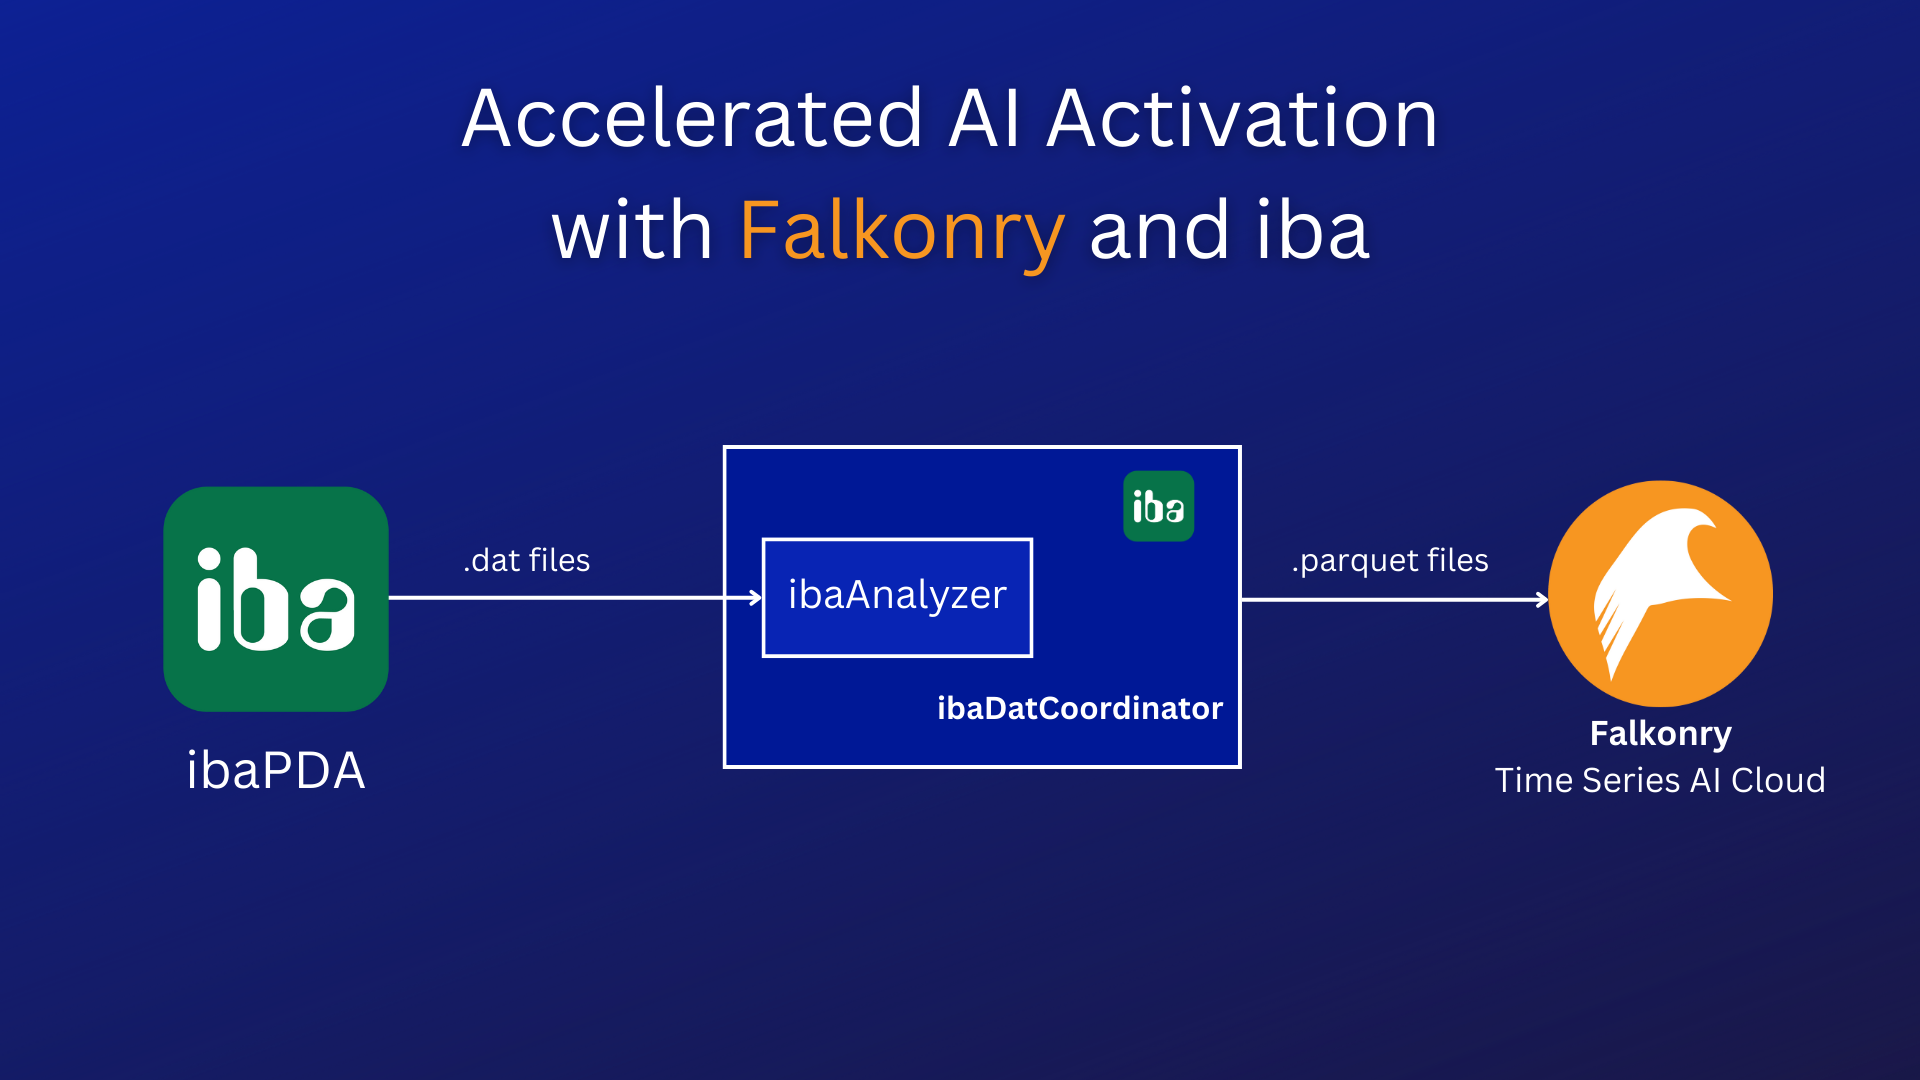
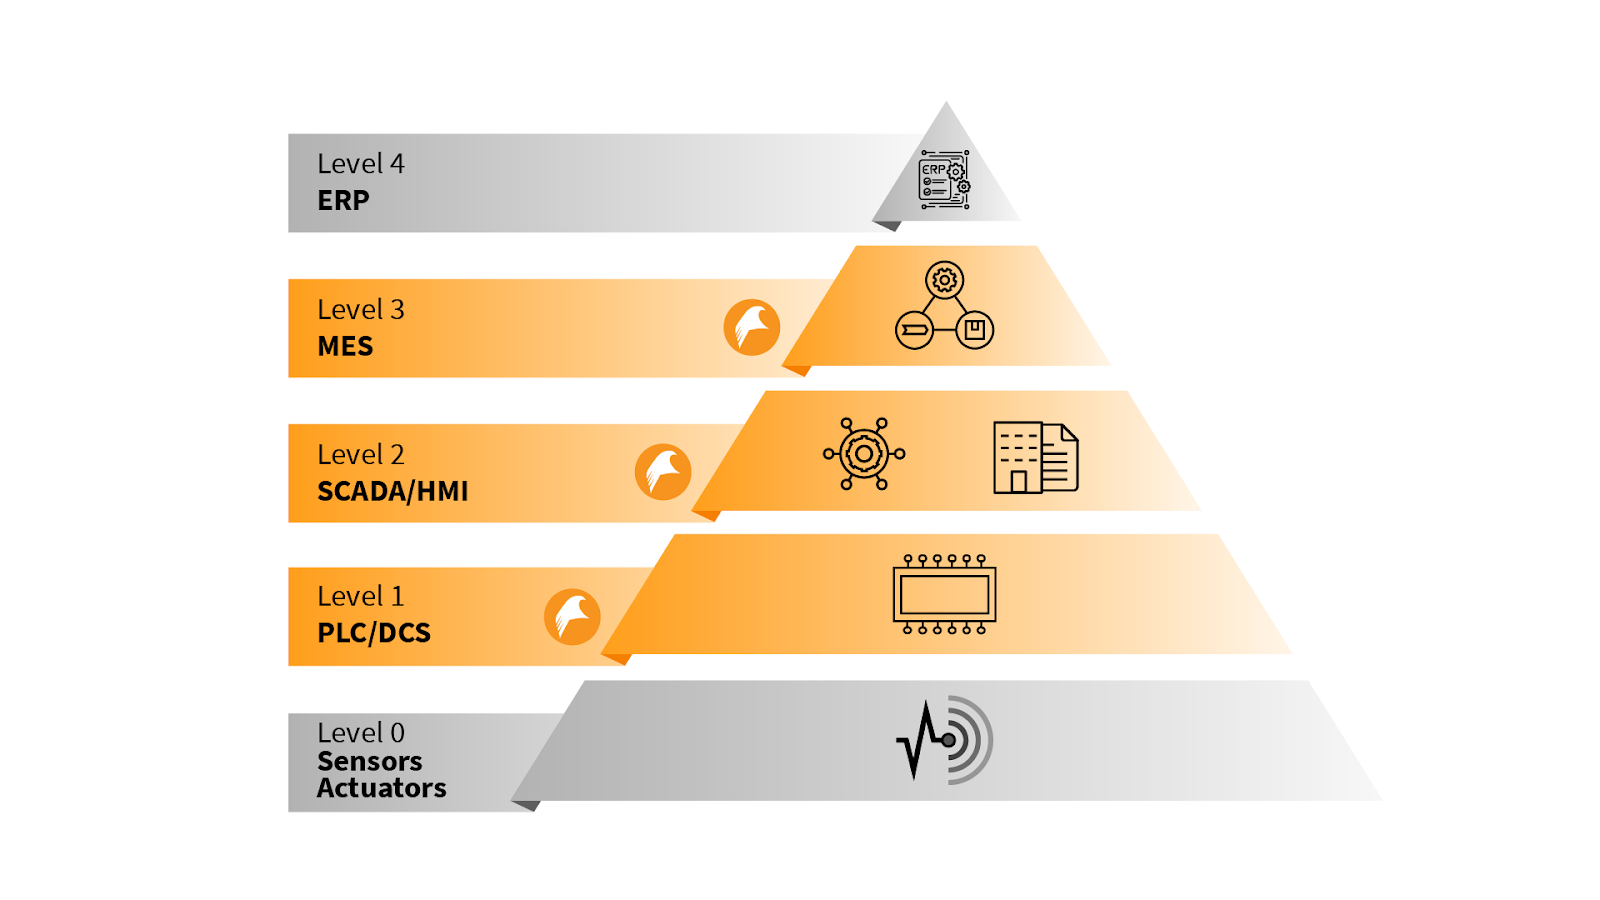
The Falkonry platform addresses the need for a centralized data platform. It is designed to readily and securely integrate with various data acquisition systems through industry-standard interfaces, enabling maximum compatibility. It can be plugged into ISA-95 Level 1, Level 2 and Level 3 systems including PLCs, SCADA, and historians using common industrial packages such as iba Analyzer, Cogent DataHub, Ignition Agent, Kepware, Azure IoT, and AWS IoT Core. These industrial packages send plant-wide data to the Falkonry platform either in standard file formats or over MQTT protocol. The time-series data received by Falkonry is continuously processed and made available for visualization and analysis.
Organizing Data
Each measurement source is referred to as a Signal and each data acquisition system is referred to as a Connection in Falkonry. The maintenance team needs to know not only what is there but also how everything fits together to plan, implement, and track the right combinations of maintenance strategies. The Falkonry Time Series AI platform makes this possible by organizing these time series signals using a hierarchy. This organization of signals is referred to as a Signal Tree in Falkonry. The signals from any number of connections can be organized in the signal tree showing the relationship between the assets and equipment forming maintainable and functional categories.
ISO 14224 industrial asset hierarchy provides a standardized way to organize these signals. In this approach, assets are organized into different levels based on their significance, criticality, and impact on operations. It is an essential tool for companies to support maintenance and replacement activities. This asset hierarchy can be populated in Falkonry as a signal tree by simply importing a csv file.
The Falkonry platform supports collaboration by allowing teams to create multiple signal trees relevant to their work and the necessary contextual information such as asset type, manufacturer information, signal type, location, etc. Each node within a signal tree represents a signal attribute such as the asset it belongs to or the sensor type. These signal attributes help in contextualizing and searching for the related signals during triage and maintenance activities improving operational efficiency.
Managing Changes Over Time
To keep the asset hierarchy valuable, the maintenance teams make sure that the asset organization information is the latest and matches the plant setting. Such changes also need to be replicated in Falkonry to keep the signal trees up-to-date and valid. The Falkonry platform visualizes each signal tree in a hierarchical view that can be traversed visually and provides all the necessary UI support to allow audits and modifications in a user-friendly way. Adding or removing an asset and updating the hierarchy structure is possible with a few clicks or via importing a csv file. As the sensor infrastructure evolves, the Falkonry platform keeps track of all the changes in the form of versions. This versioning capability along with the ease to manage asset hierarchy makes the signal trees in Falkonry the best approach to organizing signals.
Benefits
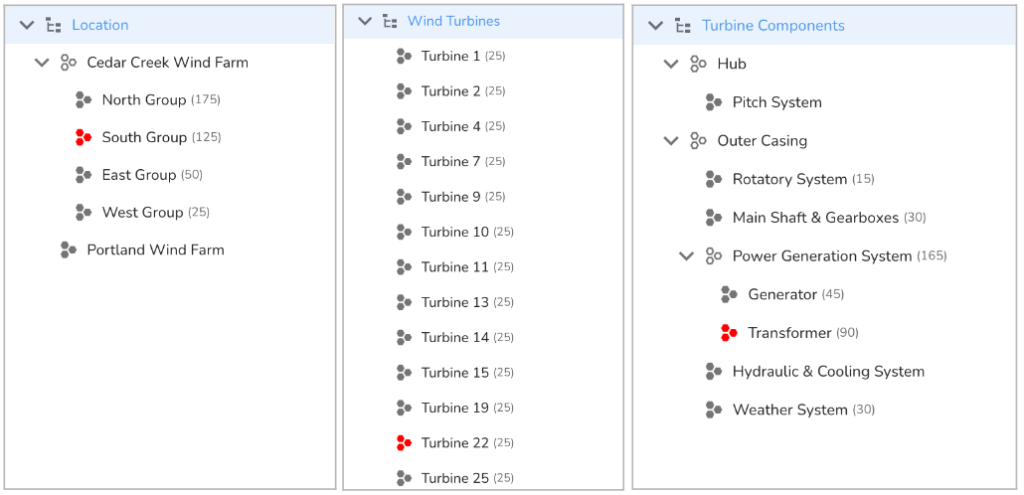
Figure 3 below depicts a few signal tree examples for a wind farm use case. The signals from wind turbines can be organized in three different signal trees contextualized by location, components, and turbine identifier. This signal organization makes it possible to determine the location and nature of problems quickly based on the behavior of associated signals.
The signal trees also support creating live dashboards to visualize relevant signals along with Falkonry-generated insights.
Falkonry leverages signal tree information to automatically learn about assets, equipment, and their physical behavior within the plant setting with no code setup or manual effort. The insights generated by Falkonry AI highlight potential problems at an equipment level so that proactive measures can be taken to improve overall asset performance and operational excellence. Maintenance teams can leverage the Falkonry-generated insights along with contextual information to plan, implement and track the right combination of maintenance strategies.