Building a Solid Analytics Foundation from Higher Technical and Higher Cultural Readiness

Key takeaways:
- Moving to predictive operations from a high technical and high cultural readiness stance is about taking small but focused steps of continuous improvement.
- Cross group collaboration is paramount because the best opportunities will be at the intersection of many stakeholders’ needs (business, data science and operations)
If you’re new to this series, please read the introduction to building a solid analytics foundation before continuing.
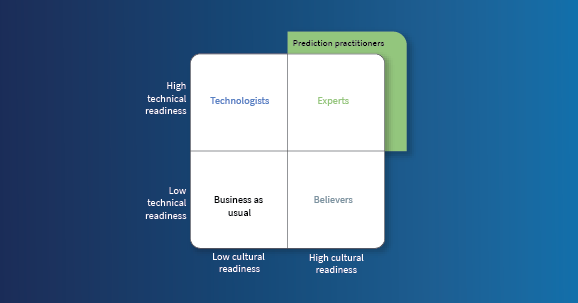
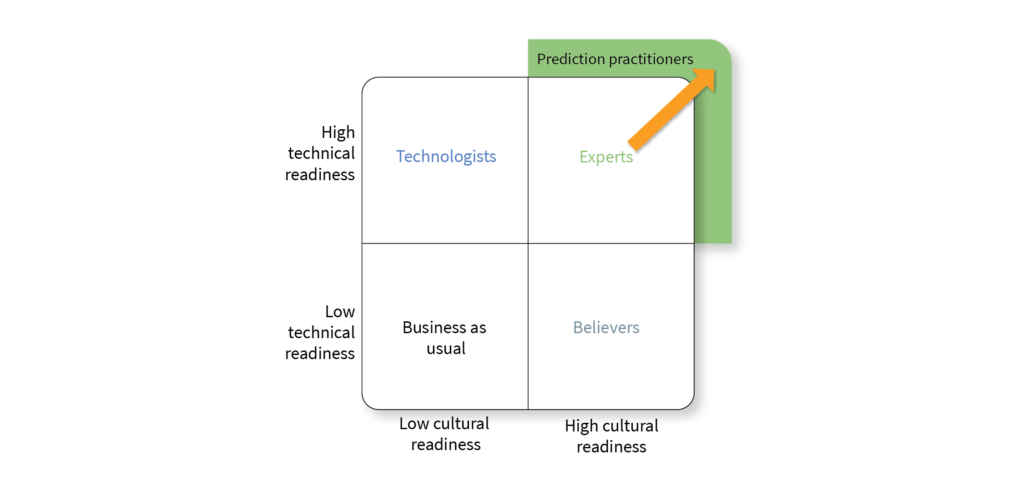
The characteristics of a high technical readiness and high cultural readiness (high-high) organization are summarized below. Remember that this isn’t a judgement, a grade or a level. This is just a convenient label for describing where an organization might start in its quest to implement predictive analytics.
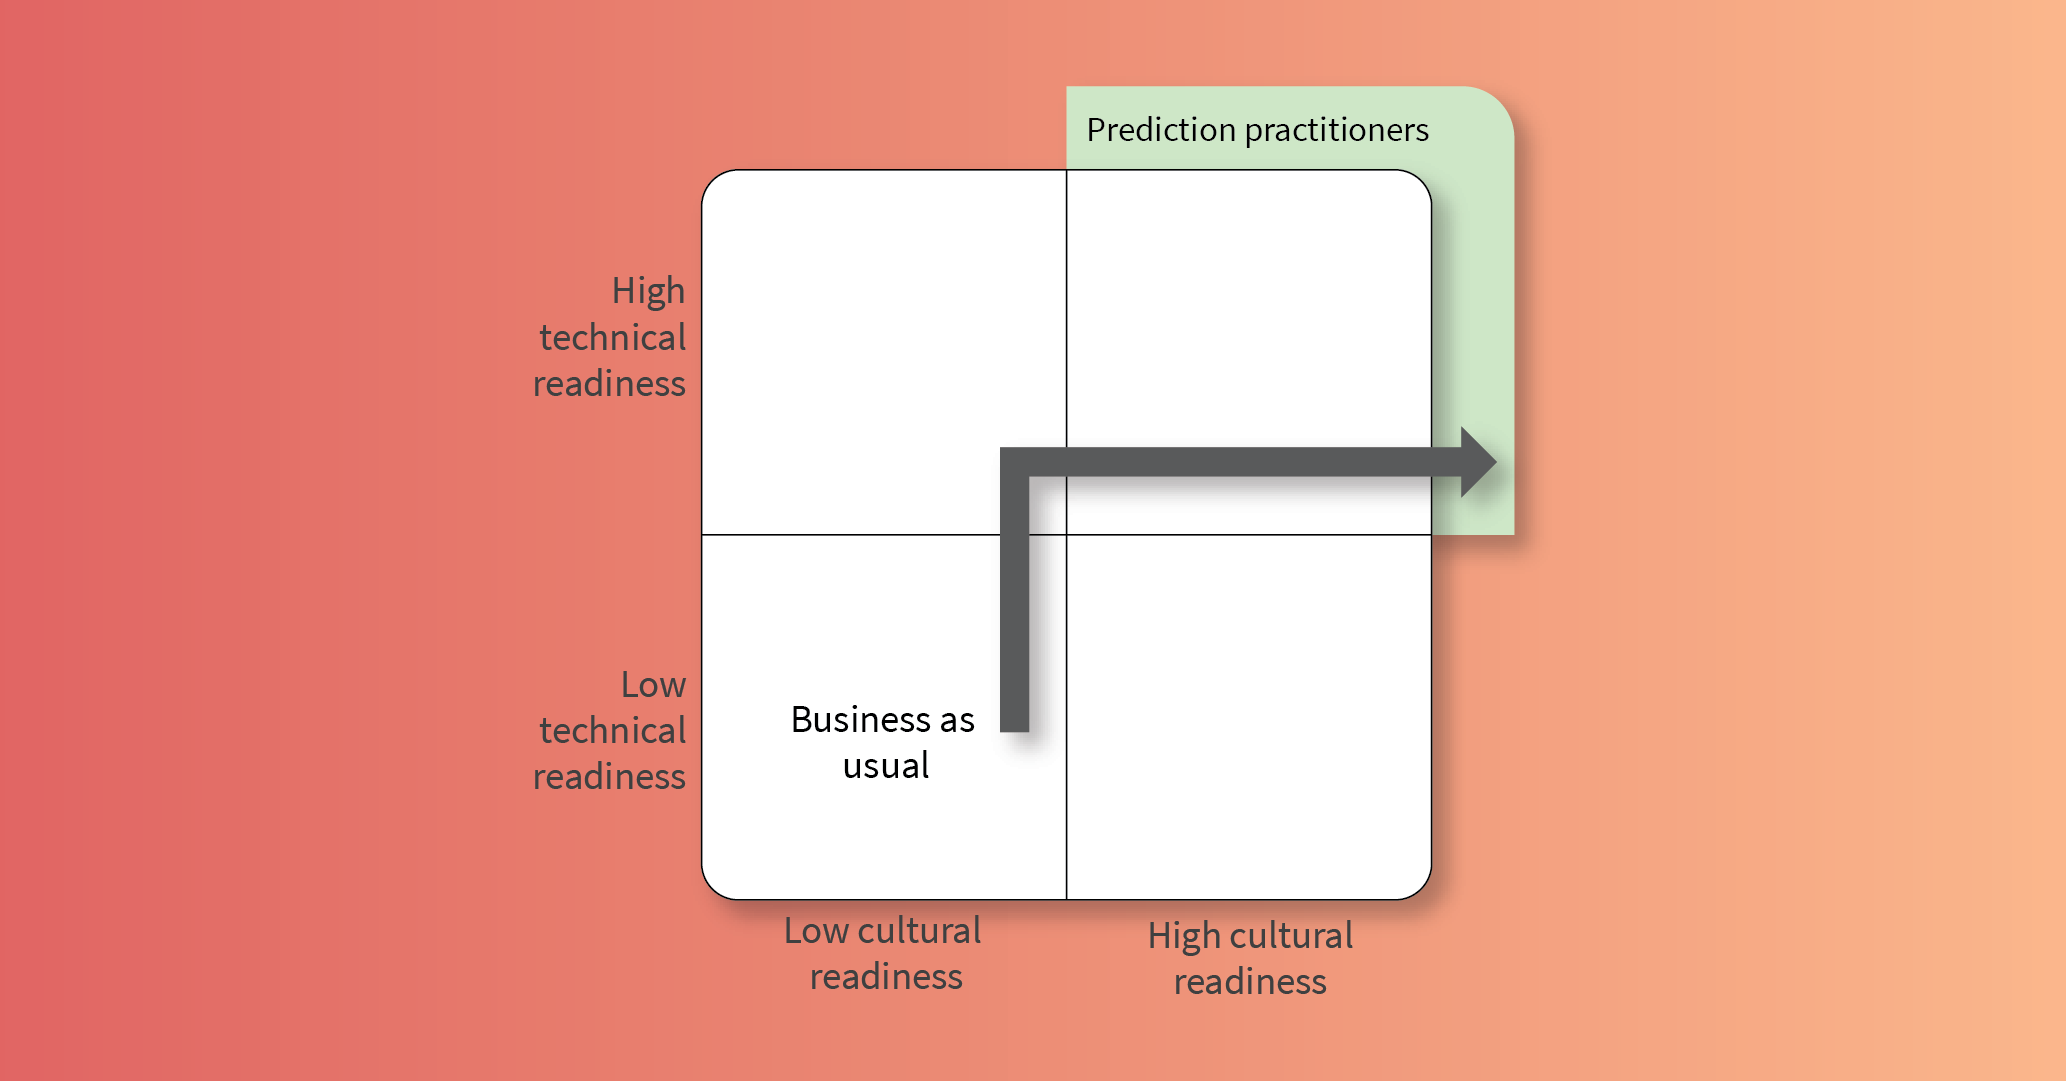
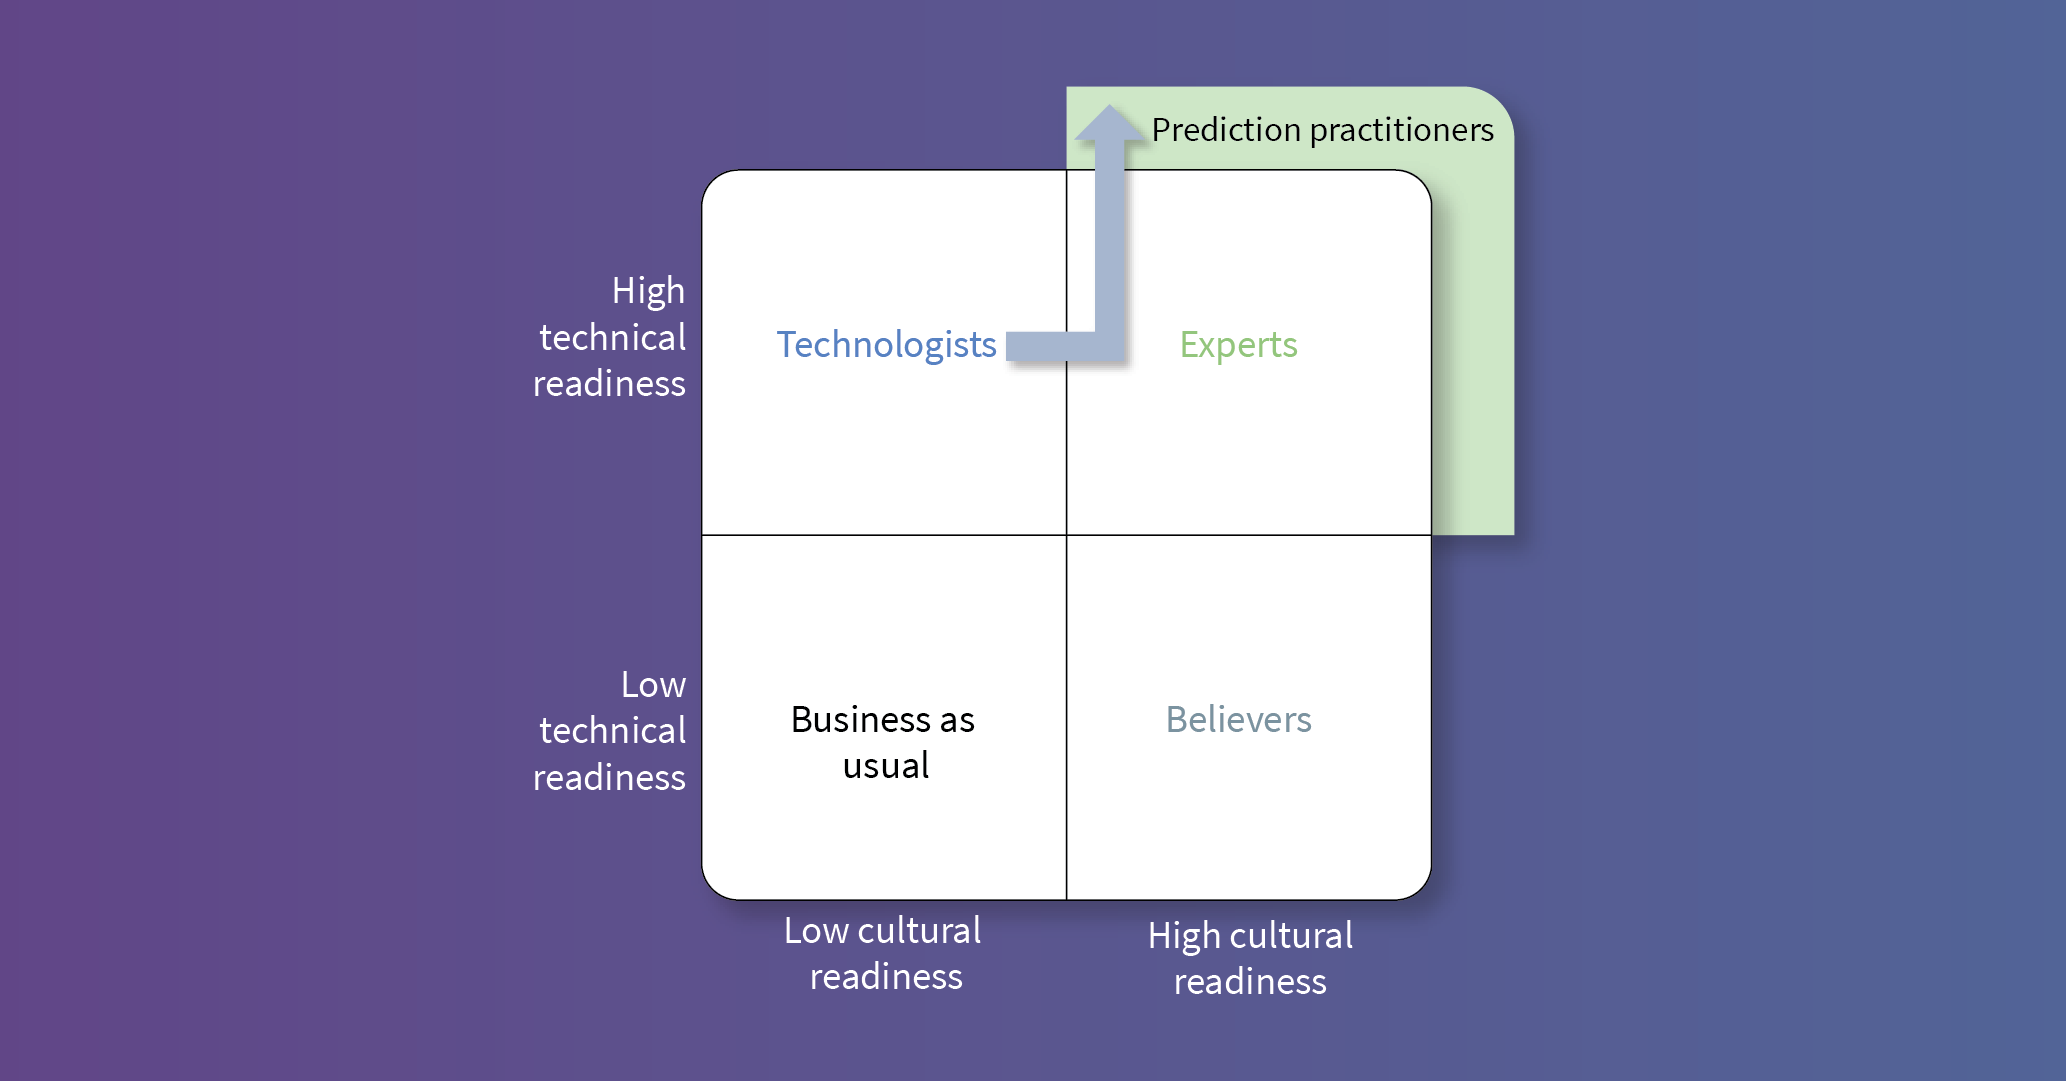
Our experience shows that moving to predictive operations from this state requires understanding where current practices might limit learning and then nudging the organization to address those limitations with cross-functionally appropriate solutions. This transition is shown schematically in figure 1 below.
By the time an organization is in a high-high stance, most of the low-hanging technical and cultural fruit have been picked. To reach fruit higher on the tree requires a nuanced understanding of capabilities, expectations and workflow within the plant. Getting this requires collaboration between the business, data and operations teams. By respecting the unique perspective, expertise and hard-won experience of the team members, it is possible to identify areas where a better understanding of and ability to predict operational patterns would close gaps in the plan to improve business outcomes.
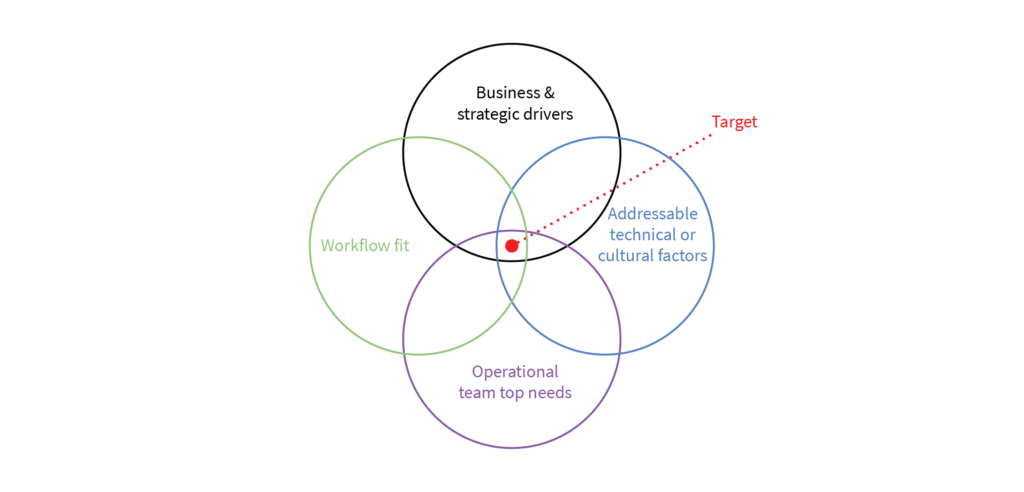
The exact challenges will vary from place to place but there are some questions which help direct collaborative conversations towards the holes remaining in an otherwise well-functioning, capable organization.
The highest leverage problems for the team to target will be at the intersection of these four areas, as outlined in figure 2.
Some additional thoughts about each of the questions are given below:
- Which business drivers will justify the effort?
Which metrics or KPIs are currently important for the management team to meet in order to improve business performance? If one “peels the onion” around those metrics what actions or outcomes drive them?
For example: Availability may be an important business driver for a line. A closer analysis of availability shows that scheduled downtime is actually a larger variable in hitting availability targets than unscheduled downtime. In analyzing scheduled downtime, the refurbishment data shows that over 50% of the refurb parts still have significant remaining useful life (RUL), suggesting that maintenance schedules are too conservative. However, it also shows that 25% of the parts have indeed reached the point of zero RUL. From this it can be concluded that if there were a better predictive model for part wear which could distinguish the very soon to fail 25% from the still-healthy 50%, on average, maintenance schedules could be extended. This would improve aggregate availability by lowering total maintenance downtime each year.
- Are there strategic objectives that lie outside the normal KPIs which are relevant to the kind of predictive work being considered?
For example: The central IT R&D organization may have an objective to identify alternative vendors for machine learning software in order to develop a viable second source and avoid vendor lock-in. This objective could be matched up to a specific plant’s need to solve an in-line quality estimation challenge where that plant does not currently have enough data science bandwidth to pursue such a project on its own.
- Is it more important to emphasize technical or cultural elements to avoid past failures?
A high-high organization has almost certainly tried a number of things which have failed or been abandoned. Are there common threads among those projects which point to specific capabilities that are lacking in certain contexts?
For example: Lack of explanatory capability in ML models (a technical gap) might have caused a number of POCs to fail because no one knew what to do in response to valid alerts. Or differences in word choice between equipment teams and between shifts resulted in poor labeling of ground truth for training and verification (a cultural gap) which meant making good models was all but impossible in a number of cases.
- What are the specific problems that most affect operation teams’ day-to-day needs?
Experience has shown that operations team participation is critical to the success of any analytics project. They have both the subject matter expertise required to interpret findings and the means to use what is found to solve actual problems. By addressing the urgent issues of the operations team, the work becomes an immediate benefit to their job rather than a distraction from it. Without this alignment it can be very difficult to get enough subject matter expert time for projects to succeed.
For example: While management might be very focused on a rare but very visible industrial drier failure which occurred 3 months ago, the operations team might be more impacted by delayed, inconsistent lab results limiting their ability to tune process settings and meet quality targets each and every day. Asking the operations team to spend more time on the, now, well-functioning drier will be rightly viewed as a distraction from the pressing problem of improving lab data.
- What can be done to make the solution to those problems easiest to incorporate into daily operations?
For information to be used it has to be presented when and where it is needed and in a way that the user can digest. A plant is a complicated place, built up from layers of legacy equipment, systems and procedures. Understanding how to weave new information into these messy, complex environments is not trivial. Ensuring analytics project success requires an understanding of where integration friction exists so that it can be smoothed over with proper design and procedures.
For example: A grinding mill is fed material at a certain rate controlled by an operator. A new warning system was brought in to determine when low quality materials were coming through the line so that the mill feed rate could be reduced to avoid overflow. However, the operators routinely ignored warnings because the warning system presented information in terms of alarm count instead of the feed rate change required. By performing the calculation for the operator and presenting the adjusted feed rate on the control screen, friction was reduced and operator compliance increased substantially.
No one group (business, operations or data science) will have the answer. However, between the groups it is possible to find challenges which will move the needle with executive management while also addressing the operations team’s daily needs and which can be done in a way that fits smoothly into the decision making workflow.
Once a reasonable list of opportunities has been detailed and aligned, an appropriate plan can be made to start addressing them. Despite the high level of technical capability and the general belief in the value of using data to solve problems, it is important to keep scaling in mind during the testing process. The data science team will not be large enough to handle daily monitoring or analysis, so whatever technology is implemented, it must be usable by the operations team. The process of applying predictive analytics at scale will be analogous to the process used to put in place the more basic analytics used by the plant. If those basic analytics are working well, it is likely that their implementation is nearly invisible to the end users. This means that the tools may not be the most capable or most flexible, but they are simple and specific enough to be used by the average operator or technician. Build on that experience and apply the same usability standards to the new predictive use cases.
As an organization in a high-high stance, analytics progress will be incremental. This is a process of polishing an already capable culture through continuous improvement. As indications of success grow, use management to skew messages towards addressing technical limitations if those are the main barriers to progress. Likewise, skew messages towards addressing cultural limitations if that is where barriers lie. Approached this way, case by case, new solutions can be characterized and deployed in a scalable fashion.
Falkonry’s time series AI can help meet the usability and integration requirements that exist at this level. Designed for use by SMEs, Falkonry’s software helps ensure that models can be created and maintained in a scalable manner. Built with a flexible, REST API for data and results, Falkonry’s software can plug seamlessly into existing, complex workflows. Contact us to learn more.