An Inventory of Needles
Key takeaways:
- Finding a needle in a haystack of data is only half of the problem. Discovering all of the types of needles in the stack is at least as important.
- Finding a specific needle and creating an inventory of needles are very different problems. Looking for a specific needle won’t help you find all needles.
- There are many benefits to focusing on the inventory-of-needles problem first.
Finding a needle in a haystack requires that you know what the needle looks like. In many areas of life, assuming this knowledge is pretty safe: needles are thin and pointy, cars are big and have tires near the bottom corners, cats are furry, four-legged with pointy ears. However, in industrial analytics, this assumption doesn’t hold up very well. What does a seal failure look like in your vacuum chamber? What does a mold breakout look like in your continuous caster? What does a bad ore grade look like in a flotation cell? When you have to describe these things in terms of the signal data from the affected equipment, the assumption of knowledge is no longer so obvious. To get around this complication, machine learning is brought in and uses examples of the target behavior to create models which describe the things of interest. With the “needles” thus defined, the algorithms can look for more instances of them in the data haystack.
However, a challenge we see frequently is a lack of detailed, accurate historical records about ground truth. That is, it is quite difficult in practice to use the records that a company keeps to point to example needles and name them with confidence. Between the variability in naming schemes (e.g. is a “tool down” the same as “stopped” the same as “EPO?”), the approximate times of events (e.g. issue seen at end of 2nd shift) and the frequently transactional nature of records (e.g. I did X, Y and Z – without mentioning what the root cause was), it is a real challenge to look back 6 months or even 3 months and to understand what was actually happening and when exactly it happened. Trying to identify good examples under these conditions is like reaching into the general area of the haystack where someone said that a needle exists, grabbing a handful of whatever is there and calling it a needle – it might work but don’t count on it.
Discovering the unknown needles in a data haystack
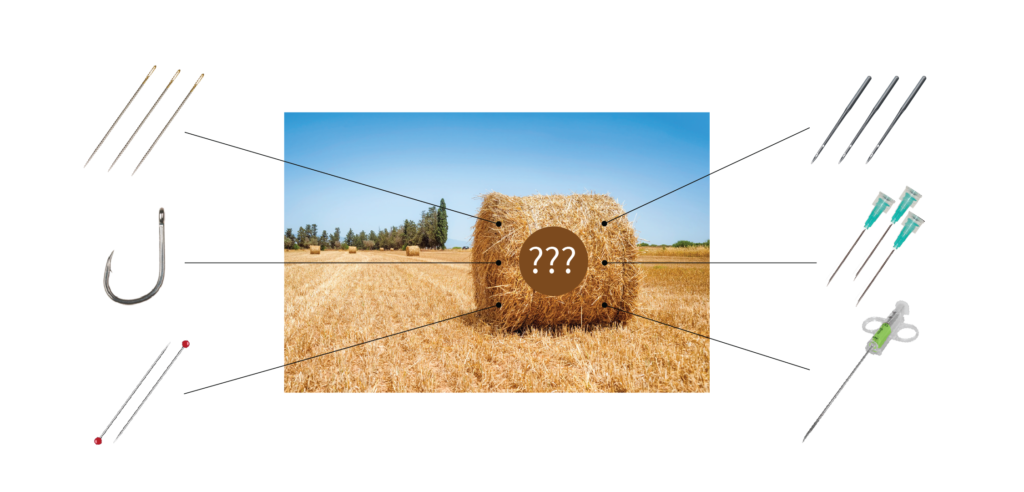
A related but slightly different challenge is understanding what kinds of needles exist in the haystack. Some needles are hooked. Some needles are made from bone instead of metal. Are you also interested in the push pins in the haystack? There is value to understanding the range of needles (sharp pointy things) in your haystack even if – especially if – you don’t know they’re there. Service and operator logs won’t capture all of the behaviors that are characteristic of interesting equipment states. Such logs will capture the major events after they have happened. There is no human-made record which can document the subtle behaviors which might be important but that don’t result in an immediate, noticeable equipment problem. For example, the service log will document that a drive chain got fouled and was cleaned, but there won’t be a written record of the increasingly common shifts in the drive motor’s behavior over the 3 days preceding that event – no one knew to look for those behaviors and nothing was “broken” yet. What can be done in both of these cases to get a more complete, more accurate accounting?

One answer is to go back in time and change business practices to ensure that all documentation is written in a formal, consistent manner by oracles who can magically attune to the equipment’s inner feelings so that a good historical record of… no…
A more realistic answer is to work in-the-now. If it doesn’t already exist, there is no way to get a good historical inventory of needles, so stop looking. Even if you find one or two examples, it most likely won’t be enough to generalize to all of the needles you are interested in. Likewise, starting the journey by putting in place new procedures, training, data infrastructure and then waiting for enough needles to be found through natural, day-to-day operations is not an optimal use of time or money. That process can easily take months before there is enough data to get started. This also won’t solve the problem of finding the needles which people don’t know about or normally react to. Instead, start where you are with an approach that lets you learn as you go.
Start with an Intelligence-first approach
Patterns of behavior in the time series data from your equipment contain a wealth of information. The problem is that humans aren’t good at parsing that information – we don’t know what to look for in the torrent of data. This can be addressed by characterizing the normal patterns of behavior in the equipment, that is, by giving examples of what hay looks like. Then the pattern detection software can discover patterns that deviate from those norms – that is identify the non-hay stuff. By doing this, the machine gives the human a much more focused set of things to look at that are likely to be interesting – things which are more likely to be needles of various sorts instead of the voluminous hay that they don’t care about. This solves both documentation problems at once: known events are captured and can be described, and previously unknown events are discovered and can be characterized. No time travel or clairvoyance is required.

By working in an Intelligence-first manner like this, the information is surfaced from ongoing operations and is therefore relevant to the operations team. This solves another problem with using historical data – stakeholder engagement. The operations team is, and should be, focused on today’s problems, not on problems from a year ago. By aligning the task (pattern verification) with the need (understanding whether my equipment is working today), it becomes much easier to test and deploy the technology required to detect and predict equipment and quality issues. Instead of saying: “please spare some time to look at this,” you can say: “these are the different kinds of needley things that you have in your haystack right now” – yes, yes. You’re welcome.
If you’re interested in taking an inventory of the needles in your haystack, give us a call to learn how to get started.


